 Whirl Offload
Features of bpftool: the thread of tips and examples to work with eBPF objects
- Meet bpftool
- Inspect and manage programs
- Inspect and manage maps
- Other generic features
- Miscellaneous operations
- Take your bpftool skills further
More and more people are experimenting with eBPF, and this is great! Alas, not everyone knows how bpftool can help manage eBPF objects. In March 2019 I started a Twitter thread to expose some of the commands and features of bpftool, a Swiss Army knife for working with eBPF. This thread was well received, and several people requested that I turn it into a blog post. Here we are!
Before we start, here are a few disclaimers. This post might look somewhat disjointed in regard with previous publications. Please keep in mind that it comes from a series of 280-characters-capped messages, reordered and expanded, but not merged into a consistent story. Also, this post is not an attempt to thoroughly document the tool (there are man pages for that). It is not a detailed tutorial either: I will not provide the code for the eBPF programs handled by bpftool in the examples (but look at this resource if you are after something more structured). Nor is it an eBPF tutorial, and readers should be warned that they are expected to know the basics about eBPF objects.
Now we can start exploring bpftool’s features. Ready to pull the thread?
Meet bpftool
Let’s start with a few generic facts about bpftool.
Source code
The source code for bpftool can be found in the Linux kernel repository, under
tools/bpf/bpftool. For example, here is the link to the directory for Linux
5.14.
Once you have downloaded the sources, you can compile bpftool by running make
in the relevant directory:
$ cd tools/bpf/bpftool
$ make
You may also want to install it on the system, or to build and maybe install its documentation:
# make install
# make doc doc-install
Packages
Some Linux distributions package bpftool. Fedora or Debian, for example, both
have a bpftool package.
Ubuntu ships it via the Linux tools:
# apt install linux-tools-common linux-tools-generic
Note that Ubuntu’s version does not contain the disassembler for JIT-compiled eBPF code.
Command-line abbreviations and completion
It’s Friday and you’re feeling lazy? Command parsing for bpftool supports abbreviations. The following:
# bpftool p d x i <id>
is the same as:
# bpftool prog dump xlated id <id>
It also has exhaustive bash completion. Hitting the tab key suggests
contextual commands, options, or even items such as available program or map
ids when relevant!
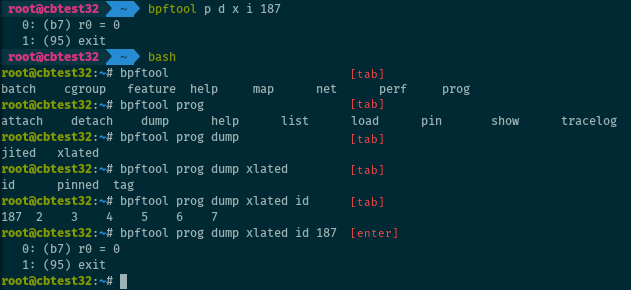
Also works when it’s not Friday.
Sadly, there is no completion available for bpftool in Zsh yet. Contributions are welcome! I would love to have completion for Zsh.
Documentation and interactive help
The tool provides interactive help for all commands with the --help or -h
options.
There is also some documentation available for bpftool. The man pages are generated from the documentation located in bpftool’s directory, in the kernel repository. There are several pages, corresponding to the different subcommands.
Version
The version of bpftool is aligned on the version from the kernel. You can print the version for your binary with:
$ bpftool version
or
$ bpftool -V
One thing to note is that recent versions will also print the optional features that the binary supports.
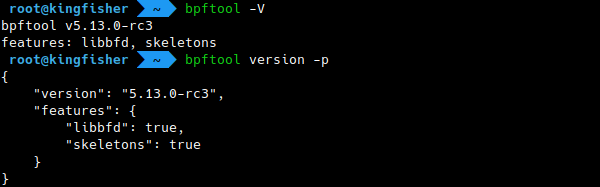
These optional features currently include libbfd support (for dumping the
JIT-compiled instructions for programs) and bpftool being built with an eBPF
“skeleton” (which is necessary, for example, to print the PIDs of the processes
using programs, or to use bpftool prog profile).
Libbpf
Note that bpftool does not implement low-level eBPF handling itself. Most of the magic comes from libbpf. This library is shipped with the kernel and mirrored on GitHub. Check it out if you need to manage eBPF objects in C or C++.
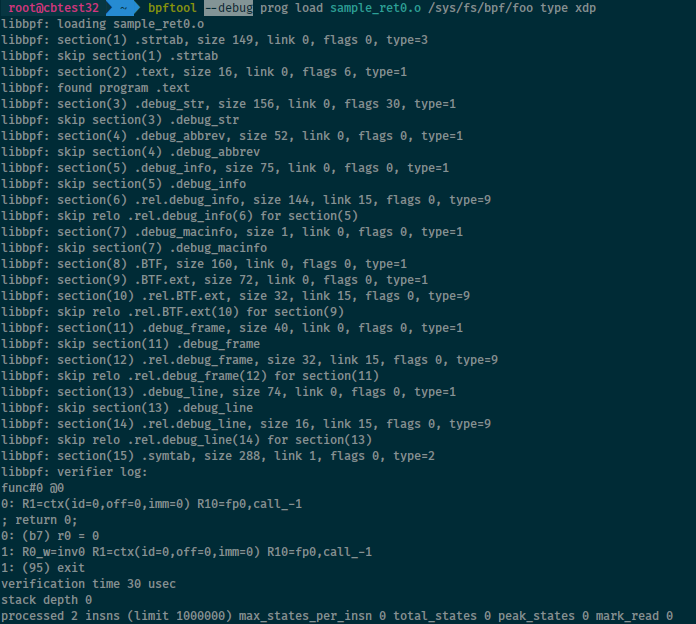
Debug output
The --debug (or -d for short) option tells bpftool to print debug-level
information from libbpf and (when attempting to load programs) from the kernel
verifier, even when all steps succeed.
Inspect and manage programs
eBPF is all about loading and running user-defined programs in the kernel. Let’s see how bpftool can inspect and interact with those programs.
Listing programs
List all eBPF programs currently loaded on the system with:
# bpftool prog show
or
# bpftool prog list
The two commands are strictly equivalent.
You can show information for a specific program, for example by passing its id (on the screenshot below, program ids are the integers displayed on the left column on the list):
# bpftool prog show id 27
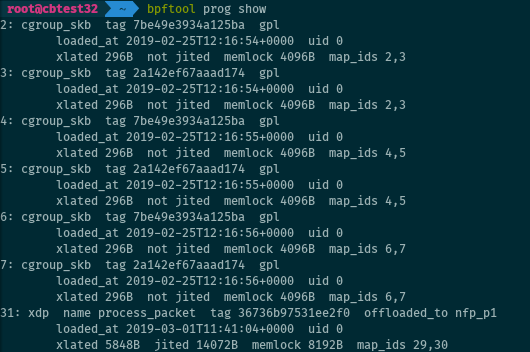
Keep in mind that a program which is loaded in the kernel is not necessarily attached (hence not necessarily running). Loading and attaching the program are two separate steps.
Loading programs
Load an eBPF program from an ELF file foo.o into the kernel and pin it under
the eBPF virtual file system as bar:
# bpftool prog load foo.o /sys/fs/bpf/bar
Pinning the program makes it persistent (and offers a handle for later management, for example to attach that program to a hook).
Dumping programs
Translated instructions
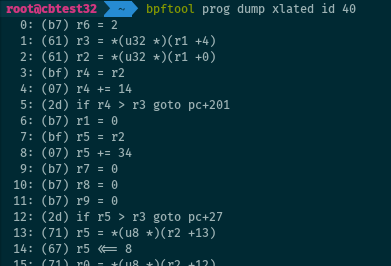
Dump the bytecode for a program loaded on the system, as “translated” instructions:
# bpftool prog dump xlated id 40
“Translated” means that the bytecode is taken after kernel rewrites (as opposed
to the output from llvm-objdump -d my_program_objfile.o). This is available
for all programs, even if the JIT-compiler is enabled.
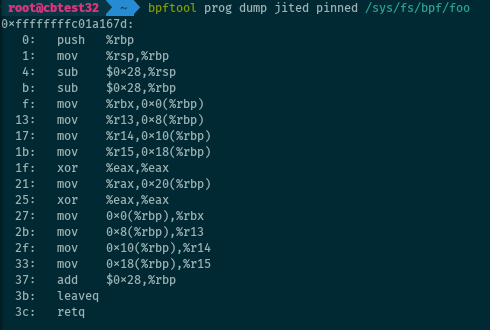
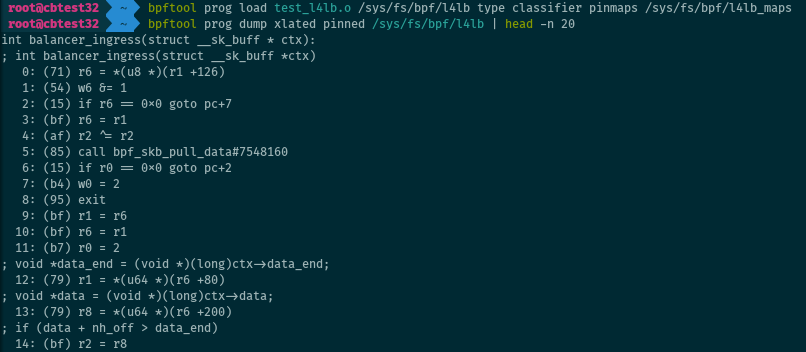
JIT-compiled instructions
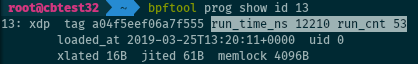
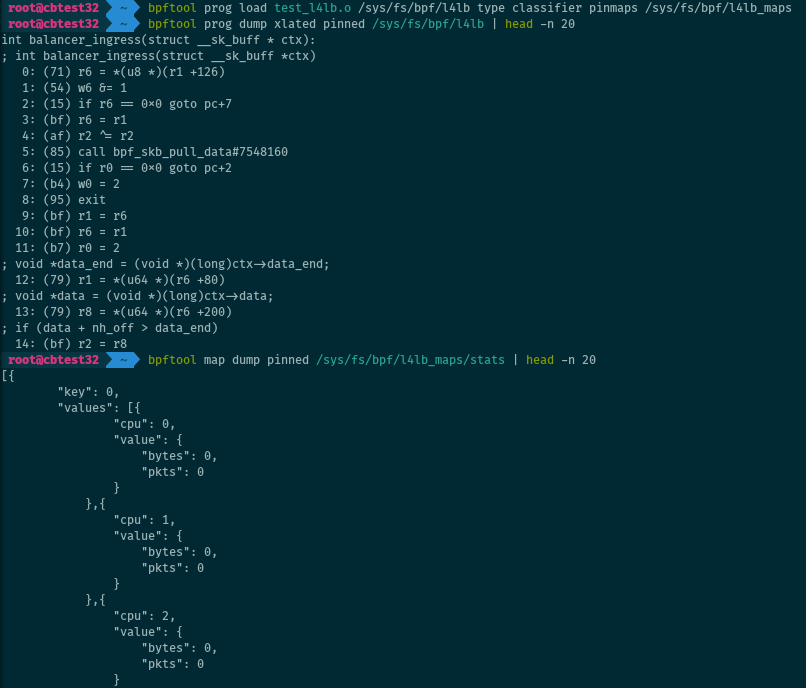
The JIT-compiled instructions for an eBPF program (below from its pinned handle) are available with:
# bpftool prog dump jited pinned /sys/fs/bpf/foo
Obviously, this works only for programs loaded when JIT-compiling is enabled.
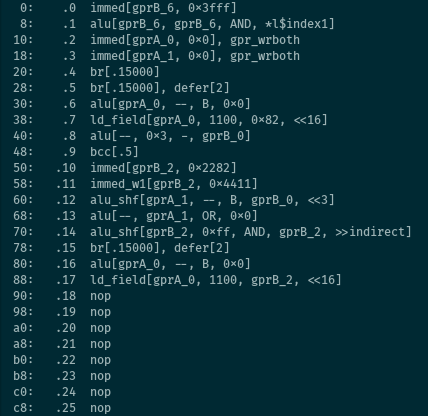
The second illustration is a dump from a sample used for hardware offload with Netronome’s SmartNICs.
Pinning programs
Let’s pin a program to the eBPF virtual file system, so we can keep it loaded once detached:
# bpftool prog pin id 27 /sys/fs/bpf/foo_prog
The pinned path can be removed with a simple rm:
# rm /sys/fs/bpf/foo_prog
This also works for maps. Details on pinning and on the lifetime of eBPF objects are available on this post.
Listing pinned paths
The pinned paths for a program, if any, can be displayed when listing the
programs by passing the --bpffs (or -f for the short version) option. This
also applies to eBPF maps.
# bpftool prog show --bpffs
# bpftool -f map
Attaching programs
Attaching programs with bpftool is somewhat tricky. There are several
subcommands providing an attach feature. They all attach programs, the
difference is that they work with different program types. Not all program
types are supported: as of this writing, attaching tracing program is not
possible with bpftool.
Once loaded, programs of the relevant types can be attached to sockets with:
# bpftool prog attach <program> <attach type> <target map>
For attaching programs to cgroup, the command differs:
# bpftool cgroup attach <cgroup> <attach type> <program> [flags
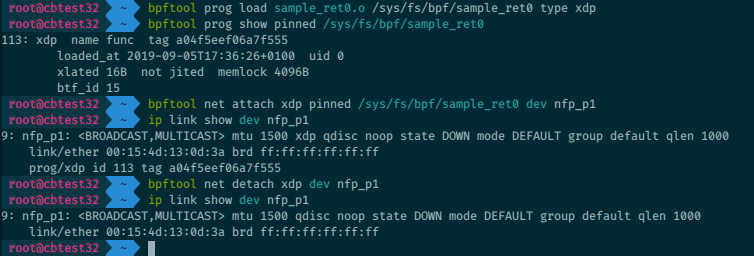
And like ip link, bpftool can attach programs to the XDP hook (and later
detach them):
# bpftool net attach xdp id 42 dev eth0
# bpftool net detach xdp dev eth0
The xdpgeneric/xdpdrv/xdpoffload variants for generic XDP (a.k.a SKB
XDP), driver XDP (a.k.a native XDP), or XDP hardware offload, are also
supported.
Advanced program loading
Reusing maps
Load a program, but reuse for example two existing maps (instead of automatically creating new ones):
# bpftool prog load foo.o /sys/fs/bpf/foo_prog \
        map idx 0 id 27 \
        map name stats pinned /sys/fs/bpf/stats_map
where idx 0 is the index of the map in the ELF program file.
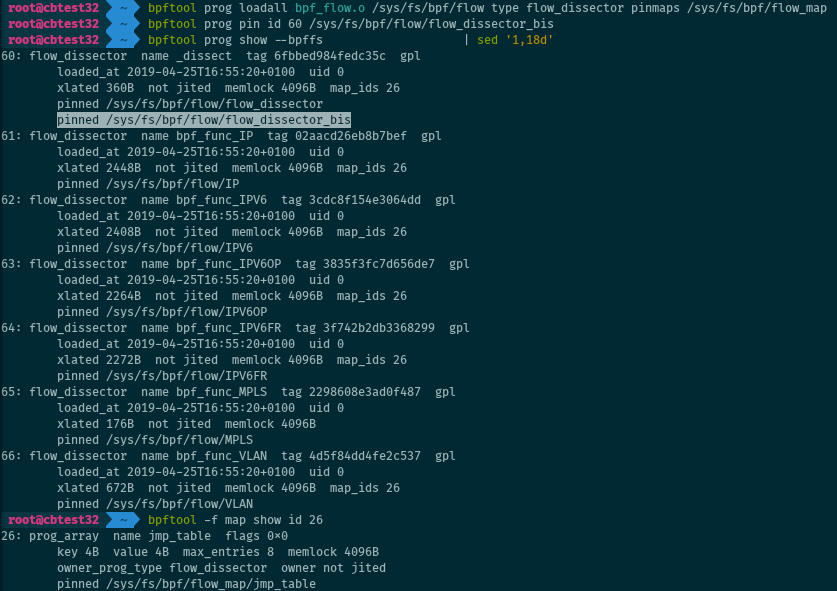
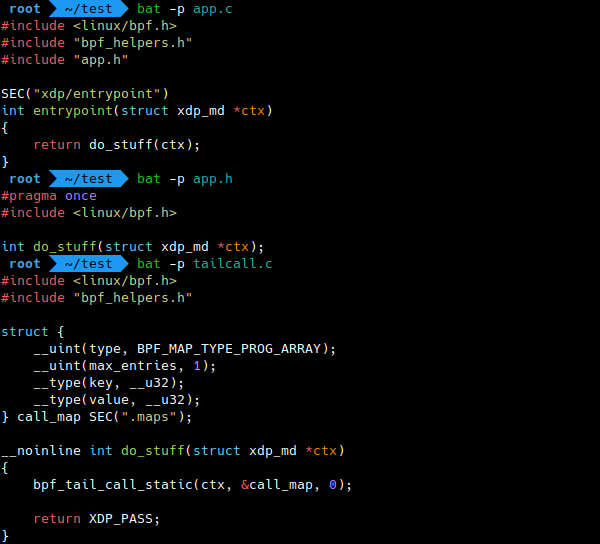
Loading several programs
For object files with more than one program, bpftool can load all of them at once:
# bpftool prog loadall bpf_flow.o /sys/fs/bpf/flow type flow_dissector
This is especially useful when working with tail calls. Maps can be pinned by
adding pinmaps <directory path in bpffs>.
BTF for programs
BTF (BPF Type Format) is a format to store debugging information about eBPF or kernel objects. One of the use cases is to embed the C instructions that were used to compile a program into eBPF bytecode. The C source code, loaded into the kernel as a BTF object along with the program, is available to bpftool in addition to the regular translated or JIT-ed instructions:
This requires:
- Passing the
-gflag to clang when compiling the program. - clang/LLVM version 8 or newer (some older versions may work with some tinkering with pahole).
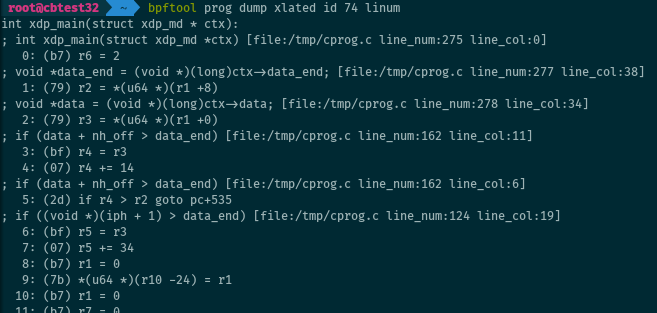
When BTF information is available for a program, adding the linum keyword
also prints the name of the C source file and the line numbers related to the
converted instructions. This may be helpful to remember where a program was
compiled from.
# bpftool prog dump xlated id <id> linum
Test-runs
BPF_PROG_TEST_RUN is a command for the bpf() system call. It is used to
manually trigger a “test” run for a program loaded in the kernel, with specific
input data (for example: packet data) and context (for example: struct
__sk_buff). It returns the output data and context, the return value of the
program, and the duration of the execution. Although this feature is not
available to all program types, bpftool can use it to test-run programs:
# bpftool prog run PROG data_in <file> data_out <file>
More options on the format for the input data and context, and for the additional argument, are available from the man page).

Profiling programs
It is possible to profile eBPF… with eBPF! Recent bpftool versions can attach programs (of types “fentry” or “fexit”) to the entry or exit of other eBPF programs and use perf events to collect statistics on them.
# bpftool prog profile <prog> <metrics>
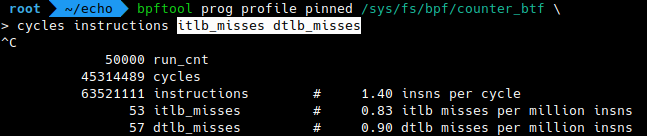
This screenshot is from the man page.
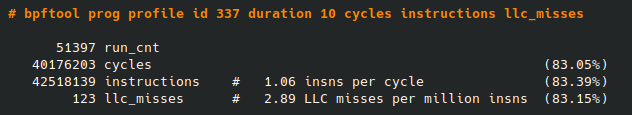
This requires that the kernel running on the system has been compiled with BTF information, and bpftool with the use of a “skeleton”.
Here is another example, featuring two metrics that were more recently added: ITLB and DTLB misses for a running eBPF program (Instruction/Data Translation Lookaside Buffer).
# bpftool prog profile <prog> itlb_misses dtlb_misses
Programs statistics
Linux 5.1 introduced statistics for attached eBPF programs: it can collect the total run time and the run count for each program. When available, this information is displayed by bpftool when listing the programs:
# bpftool prog show
But gathering statistics slightly impacts performance of the program execution (~10 to 30 nanoseconds per run), so it is disabled by default. Activate it with:
# sysctl -w kernel.bpf_stats_enabled=1
Advanced program listing
Reference by name
Program names can be used on the command line to tell bpftool what eBPF program to work with (as an alternative to program ids, tags, or related pinned path in the eBPF virtual file system):
# bpftool prog show name loadbalancer
Processes PIDs
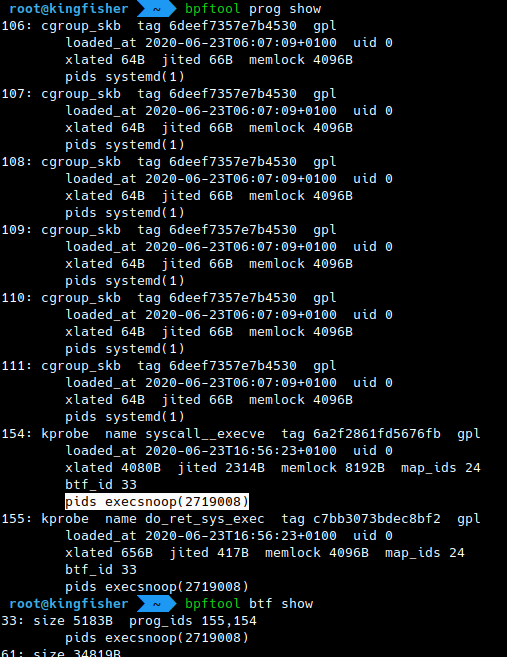
In addition to the usual information displayed on program listings, recent versions of bpftool became capable of collecting the PIDs of the processes holding file descriptors to the eBPF programs. This also applies to other eBPF objects (maps, links, BTF objects).
# bpftool prog show
# bpftool map
# bpftool link
# bpftool btf
This requires that the kernel running on the system has been compiled with BTF information, and bpftool with the use of a “skeleton”.
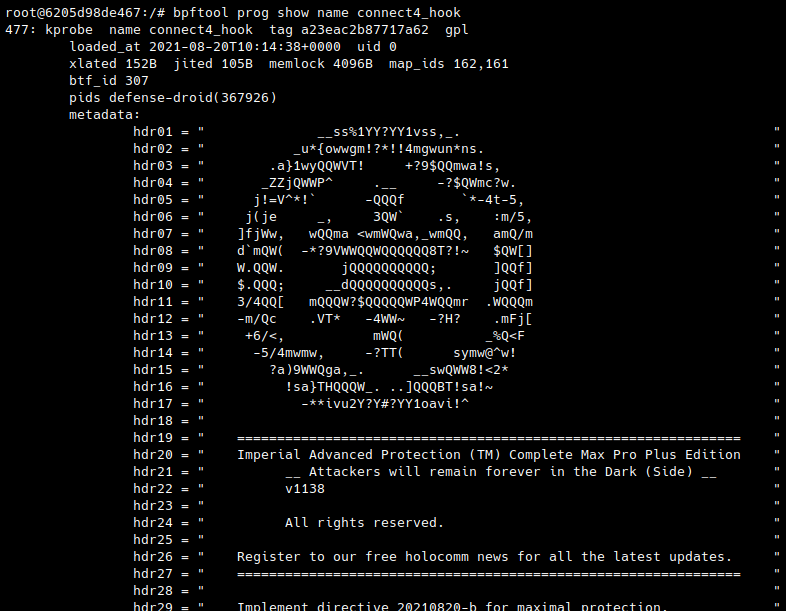
Program metadata
Linux 5.10 introduced the possibility to attach custom metadata to eBPF programs. Of course, bpftool will dump this data when listing programs.
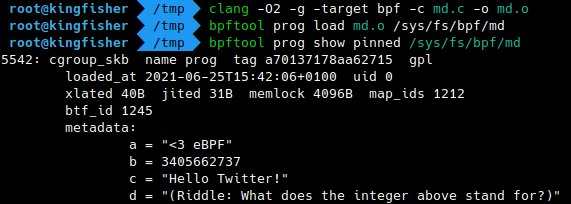
The Capture-The-Flag challenge of the eBPF Summit 2021 featured a nice use case for this: it embedded some top-secret information as metadata to display with bpftool.
Inspect and manage maps
eBPF programs can share data between them, or with user space, through maps. Inspect or interact with them from the command-line with bpftool.
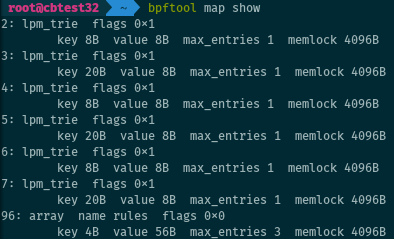
Listing maps
Just like bpftool can list programs, it does the same for maps.
# bpftool map show
or its alias:
# bpftool map list
Show a single map with, for example:
# bpftool map show id 7
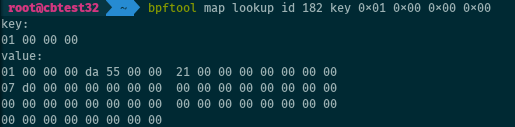
Map lookup
Let’s retrieve one entry from a map, here the second entry of an array map (note the use of host endianness for passing the key):
# bpftool map lookup id 182 key 0x01 0x00 0x00 0x00
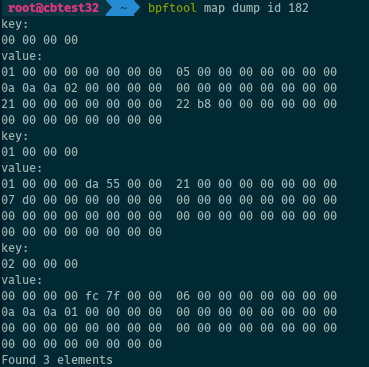
Map dump
Alternatively, we can dump all entries of the map at once:
# bpftool map dump id 182
Creating a map
It is possible to create a map with bpftool. Once created, the map is pinned under the eBPF virtual file system (or it would be lost when bpftool exits, as no eBPF program uses it yet).
# bpftool map create /sys/fs/bpf/stats_map \
        type array key 4 value 32 entries 8 name stats_map
This works for most (but not all) map types, although some may come with constraints on the key or value size or the number or entries they expect.
Map update
Update
Let’s update an entry of a map:
# bpftool map update id 7 key 3 0 0 0 value 1 1 168 192
For compatible map types, bpftool map update is also used to create new
entries, and bpftool map delete to remove them. Hash maps support this, but
arrays are fixed in length and all their entries exist from the creation of the
map and can only be updated.
Hexadecimal values
There is a hex keyword to conjure the use of hexadecimal numbers in command
keys and values. All the syntaxes below are equivalent:
# bpftool map lookup id 7 …
    … key 3 15 32 64
    … key 0x3 0xf 0x20 0x40
    … key 0x03 0x0f 0x20 0x40
    … key hex 03 0f 20 40
Program array updates
We can even update “prog_array” maps (which hold references to eBPF programs, for tail calls).
# bpftool map update pinned /sys/fs/bpf/my_prog_array_map \
        key 0 0 0 0 value pinned /sys/fs/bpf/my_prog
The map must be pinned for this to work, as the kernel flushes the program array maps when they have no more references from user space (and the update would be lost as soon as bpftool exits).
Iterating over map entries
Iterating over the entries of a map is especially useful with hash maps, which have no predictable array indices. With bpftool, this is as simple as:
# bpftool map getnext id 27 key 1 0 0 10
It returns the key of the “next” entry. If no key is provided, it returns the “first” key from the map.
BTF for maps
BTF can also provide information on the structure of map entries. When
available, bpftool uses this information to format the entries on map dumps
(bpftool map dump).
This requires:
- Passing the
-gflag to clang when compiling the program. - clang/LLVM version 8 or newer.
- In the C source code, the declaration of maps must use specific type macros.
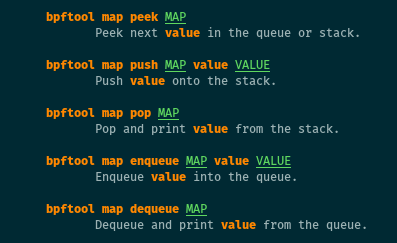
Stack and queue maps
Linux 4.20 brought stack and queue maps to eBPF, and bpftool can manipulate
them. Because such maps do not rely on keys (only on values), handling them
differs somewhat from bpftool map lookup/update:
# bpftool map pop/dequeue/peek <map>
# bpftool map push/enqueue <map> value <val>
Freezing maps
For some specific use cases, it is possible to “freeze” maps for user space. This makes them read-only from user space, but the permissions are unchanged for the eBPF programs which can still update the map.
# bpftool map freeze id 1337
Other generic features
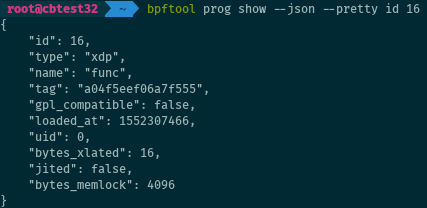
JSON support
The output of bpftool can be formatted as JSON. The --jon (-j for short)
switch enables JSON. The --pretty (or -p) option enables JSON as well, but
also makes it human-readable by inserting line breaks and indentation. Here is
an example for retrieving information on a program.
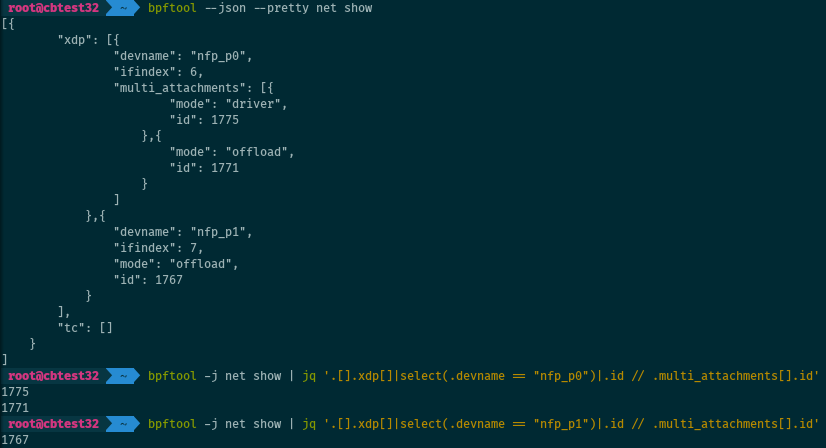
Avoid grepping patterns from bpftool’s plain output, especially in scripts.
Always prefer the JSON output, which is more stable and consistent. Use
jq: for example, we can get the IDs of all
XDP programs attached to eth0 with:
# bpftool -j net show | \
    jq '.[].xdp[]|select(.devname == "eth0")|.id // .multi_attachments[].id'
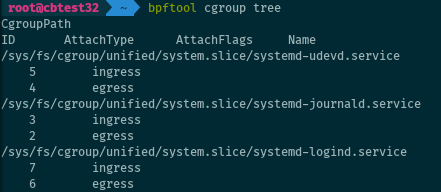
Programs and cgroups
Coming back to the cgroups: bpftool can show the programs attached to a given cgroup.
# bpftool cgroup show <cgroup>
It can also iterate over cgroups and show all programs (with no argument it defaults to the cgroup v2 mountpoint):
# bpftool cgroup tree [cgroup-root]
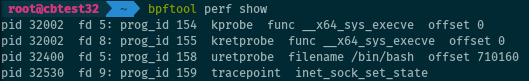
Listing tracing programs
Like with cgroups, bpftool can list all tracing eBPF programs currently attached on the system (to tracepoints, rawstracepoints, k[ret]probes, u[ret]probes). As simple as:
# bpftool perf show
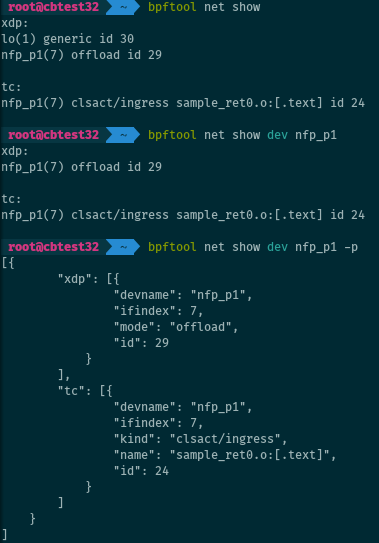
Listing networking programs
There is also a mode for listing programs related to network packets processing.
# bpftool net show
This lists programs attached to TC or XDP hooks. It is possible to filter on a given interface:
# bpftool net show dev <iface>
BTF inspection
Listing BTF objects
Besides using the BTF information associated with programs or maps when dumping them, bpftool can list BTF objects directly. BTF objects can contain information on a program, on a map, on the kernel or on a module (the associated program or map does not have to be loaded into the kernel for the BTF object to exist). They serve for several use cases.
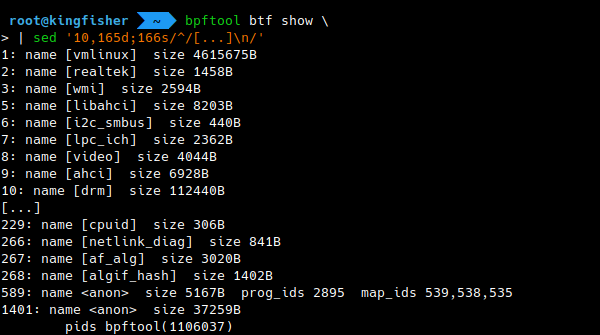
# bpftool btf show
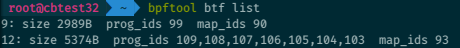
Listing BTF objects on the system with bpftool even accounts for BTF information for the kernel and its modules, if available.
On the illustration below, note the names for the kernel (vmlinux) and the
modules, and the <anon> (anonymous) names for BTF objects related to programs
and maps.
Dumping BTF objects
The BTF objects loaded on the system can be dumped with bpftool. In addition, bpftool can extract and dump the BTF information contained in an ELF object file.
# bpftool btf dump <btf_source>
More details are available from the relevant man page.
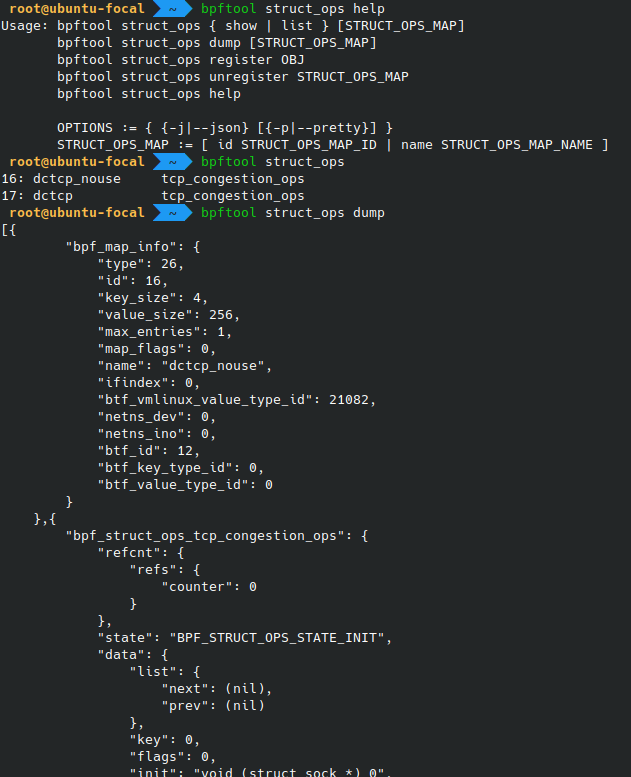
Struct ops programs
“Struct ops”
programs
are eBPF programs replacing specific sets of operations in the kernel. One
example use case is the implementation of custom algorithms for congestion
control for TCP, by substituting an eBPF program to the kernel’s struct
tcp_congestion_ops. From the command-line, bpftool can list, dump, register
and unregister such “struct ops” programs:
# bpftool struct_ops …
Refer to the relevant man page for the details on the different commands.
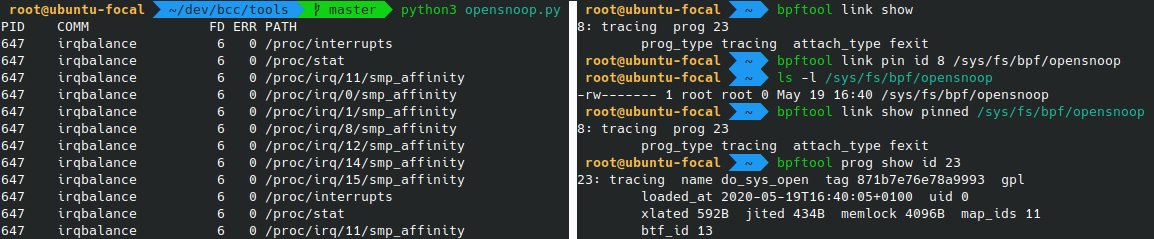
Links
Linux’s eBPF link abstraction is used to represent and manage links between programs and hooks. And bpftool can show or pin such links:
# bpftool link show
# bpftool link pin id 27 /sys/fs/bpf/my_link
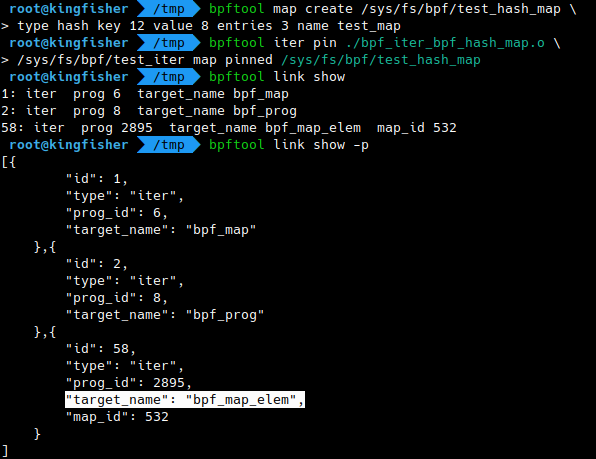
Iterators
eBPF
“iterators”
use seq_ops to help iterate on kernel data (think /proc-like information
created with eBPF. To work with such iterators, bpftool has a specific iter
subcommand.
# bpftool iter pin <objfile.o> <bpffs_path>
# cat <bpffs_path>
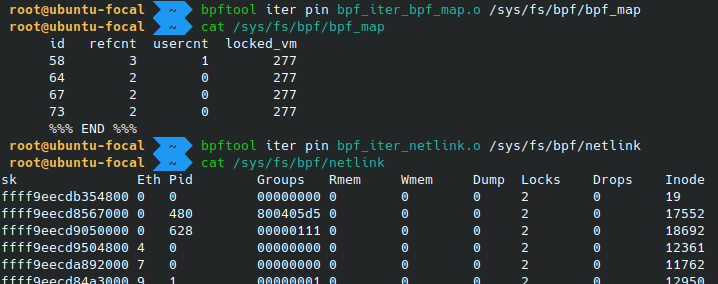
Iterators are referenced in the kernel by eBPF links. While bpftool does not support listing iterators directly, they can be found in the lists of loaded programs or of existing links. The latter provides additional context information, such as the target’s name and map id.
Batch mode
There is a batch mode in bpftool for running several commands at once:
# bpftool batch file <file>
It can read commands from standard input if <file> is -:
# echo 'prog show \n map show \n net show' | bpftool batch file -
Use # at the beginning of lines in the batch file to denote comments.
Miscellaneous operations
The features below are not part of a typical, basic workflow for loading, inspecting, and managing eBPF objects. But they are interesting to know, because they can help with troubleshooting or solve advanced use cases. And some are fun.
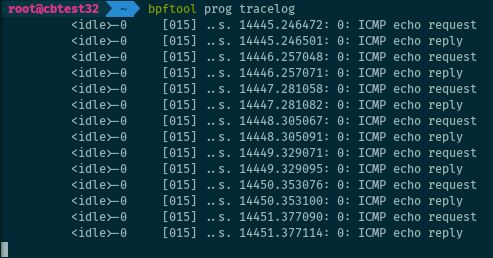
Dumping the trace pipe
When using the bpf_trace_printk() helper, a program will print its output to
the trace pipe at /sys/kernel/debug/tracing/trace_pipe, and the user can
retrieve the logs by reading the file. But the name of the file is not so easy
to remember. As an alternative, bpftool offers a way to dump the trace pipe:
# bpftool prog tracelog
It’s also shorter to type than
# cat /sys/kernel/debug/tracing/trace_pipe
For the record, this is based after a similar feature in iproute2, tc exec bpf
dbg.
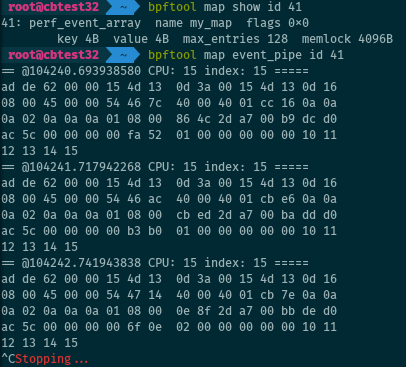
Dumping a perf event pipe
More complex to use than bpf_trace_printk(), but more flexible and much
faster, perf events can be used to stream data to user space. And bpftool can
dump this data:
# bpftool map event_pipe <MAP> [cpu <N> index <M>]
See also the description for the bpf_perf_event_output()
helper.
More efficient than the event pipe is now the eBPF ring buffer, but bpftool does not support it as of this writing.
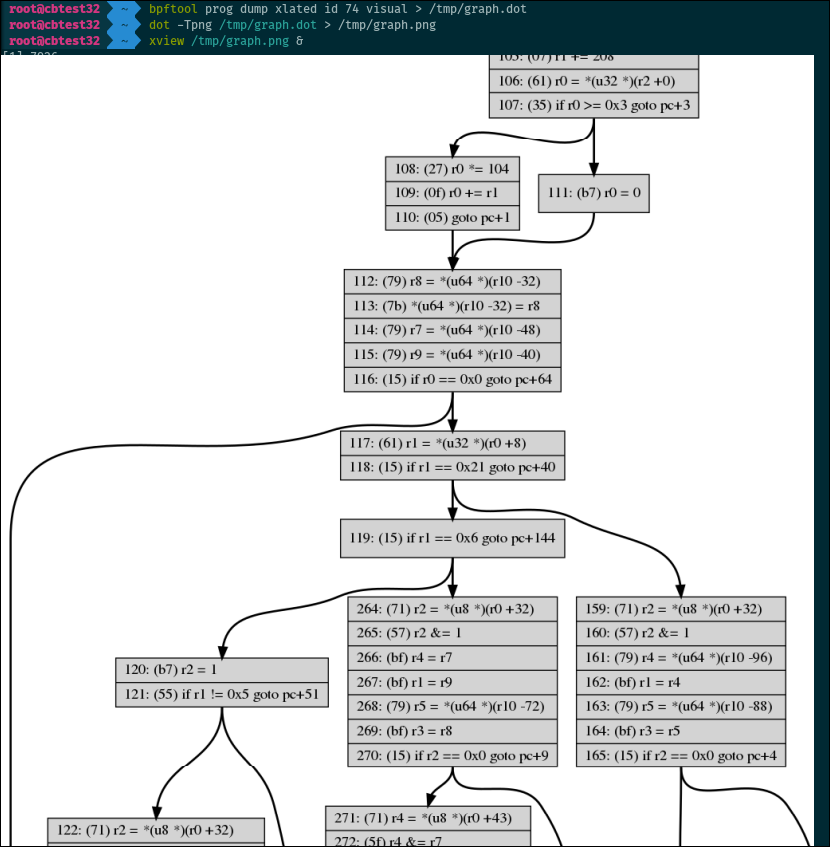
Dumping the control flow graph
Believe it or not, bpftool can dump the control flow graph of a program in a
format compatible with DOT. Use
dot on the output to generate a graph representing all the possible paths of
execution of a program.
# bpftool prog dump xlated id <id> visual
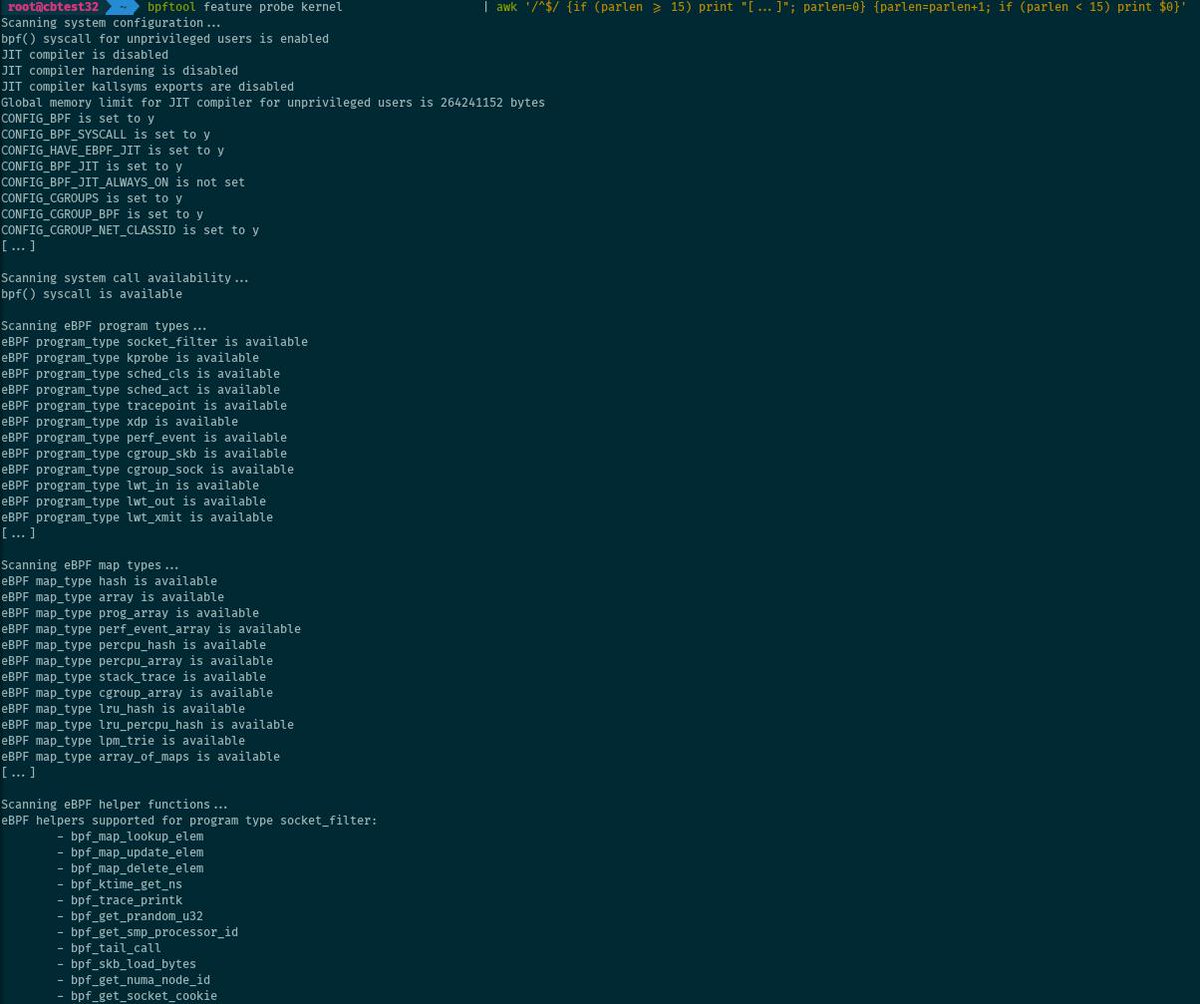
Feature probing
Feature probing is useful to see what eBPF-related features are supported on the system.
# bpftool feature probe kernel
The command dumps a list of eBPF-related kernel configuration options and
sysctl values, as well as the availability of the bpf() system call,
supported eBPF program and map types, and supported helper functions for the
system.
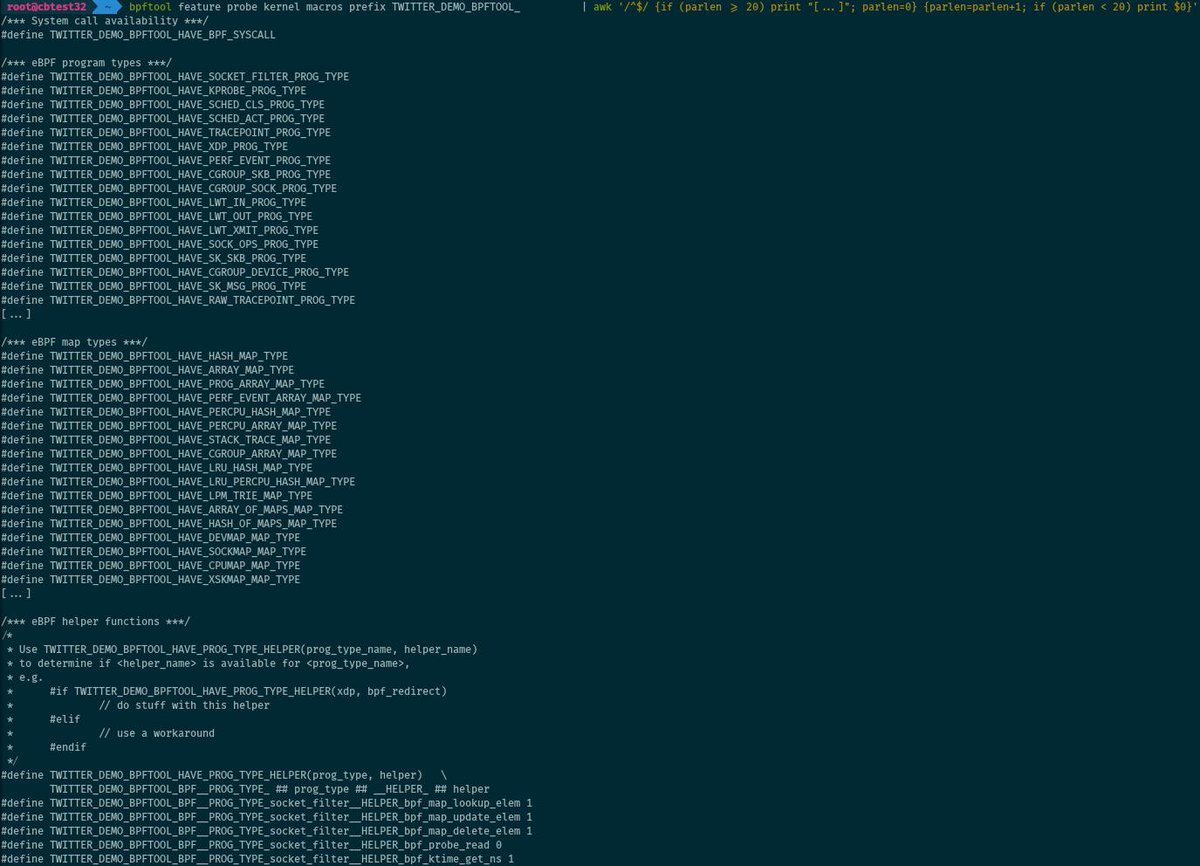
In addition to the plain output and JSON, the list of features can be dumped as a set of macros, ready to be included into a C header file and to be reused in a project.
# bpftool feature probe kernel macros [prefix <namespace_prefix>]
Hardware offload compatibility
eBPF hardware offload works well with bpftool, and it can list, load, dump, etc. the programs and maps offloaded to a SmartNIC. It can also probe eBPF-related features supported by the hardware:
# bpftool feature probe dev <ifname>
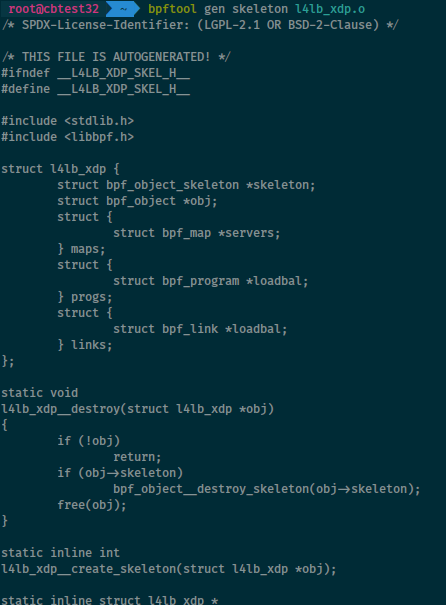
Generating a skeleton
User application skeleton
A “skeleton” header file helps create user space applications that can manage a given eBPF program. By passing the eBPF object file to bpftool, we can ask it to generate the relevant skeleton:
$ bpftool gen skeleton bpf_prog.o > user_prog.h
The application can then #include "user_prog.h".
More details in the relevant man page.
Lightweight skeleton
With the -L option, bpftool works with “lightweight skeletons” using specific
eBPF programs to call the bpf() system call from the kernel side and to load
other eBPF objects!
$ bpftool gen skeleton -L prog.o
Debug with:
# bpftool prog load -d -L prog.o
More details in the relevant commit log or on LWN.net).
Static linking
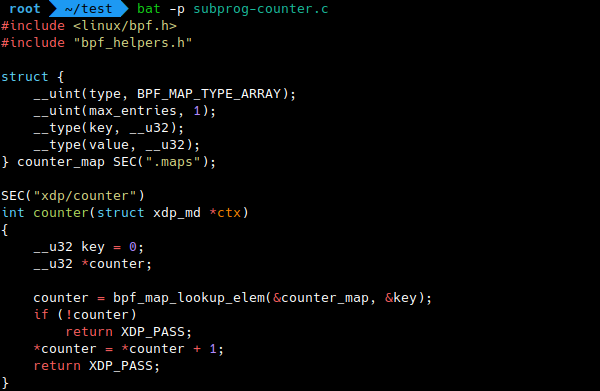
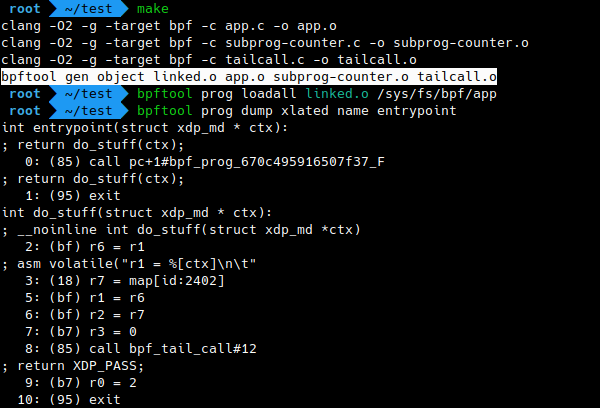
This is a recent addition as I write this post, but surely this is an extremely important one. Libbpf can do static linking of multiple ELF object files containing eBPF objects, and bpftool provides a front-end for it.
$ bpftool gen object output.o input1.o input2.o …
The multiple input ELF object files are linked and merged into a single
output.o ELF object file. This makes it possible to link functions,
subprograms, …, defined in independent object files. Should we expect eBPF
libraries coming soon?
Take your bpftool skills further
Did you read through all the bpftool features and examples in this post? Congratulations! I hope that you learned something, and that your new skills will turn useful soon. So, where to go from here?
If you want to learn even more about the different commands for the tool, the best way is to read the documentation.
If, instead, you want to see me talk about bpftool’s features, you can have a look at episode 11 of the eCHO podcast (eBPF & Cilium Office Hours). I present a number of the features described in the current post, with more explanations. The materials used in the podcast are on GitHub.
Of course, the best way to get familiar with a tool remains to get your hands dirty and fiddle with it. If you don’t have bpftool on your machine yet, you should install it and start listing the eBPF objects loaded on your system. Did you know that systemd may load a few programs on some distributions, for example? Then if you work with eBPF, bpftool will soon become a useful assistant. Who knows, you could end up contributing to the tool itself! … And if you add new features, we’ll make sure to update that Twitter thread :-).
Have fun with bpftool!